Industrial electricity prices in the EU: how they are measured and how to read them
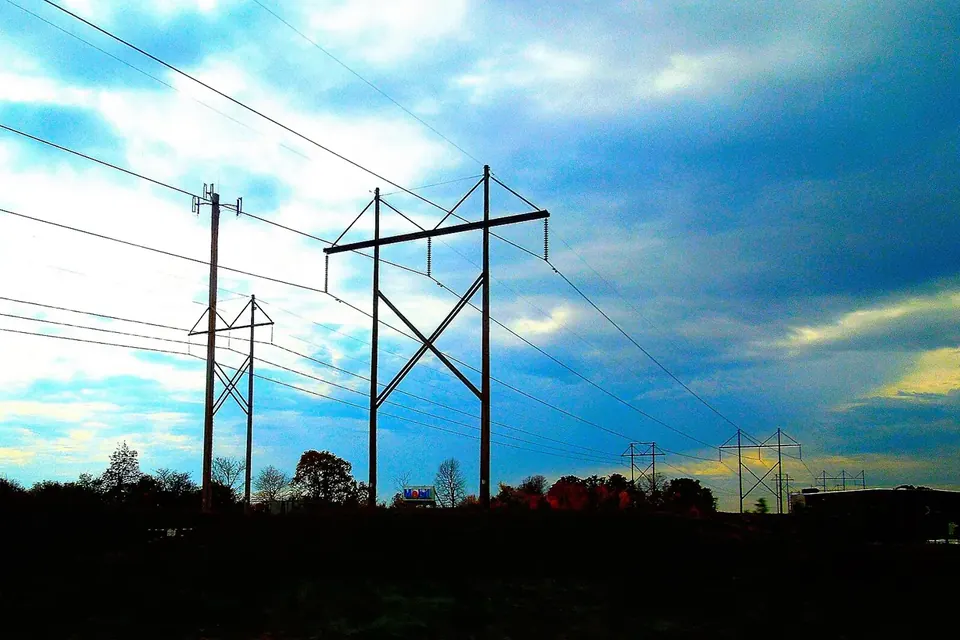
For crystal growing, Acheson furnaces, polysilicon refining and chip fabs, electricity is not an overhead but a core input. Comparing sites therefore means comparing electricity prices, and that is easy to get wrong. This article explains how the official EU figures are built, so that the right number is compared with the right number. It deliberately quotes no prices: they change every half-year and are best read at the source.
Why the question matters for this industry
The Acheson process that makes silicon carbide is heated entirely by electrical resistance at roughly 1700 to 2500 °C (Fiven; see the Acheson process). Crystal pulling, casting, wafer sawing, cleanroom ventilation and ultrapure water production all run continuously. Mario Draghi's 2024 report on European competitiveness put the problem bluntly: EU companies still face electricity prices that are two to three times those in the US (The future of European competitiveness, 2024). Such headline comparisons are useful as context, but a site decision needs the figures for a specific country and consumption profile.
The official source: Eurostat
EU-wide electricity price statistics are collected under Regulation (EU) 2016/1952 on European statistics on natural gas and electricity prices. Eurostat publishes them twice a year, as averages for the first half (January to June) and the second half (July to December) of each year (Eurostat, Electricity price statistics).
Two datasets matter for industry:
- nrg_pc_205: half-yearly prices for non-household consumers, available from 2007.
- nrg_pc_205_c: annual breakdown of non-household prices into their components.
Consumption bands
Prices are reported for seven bands of annual consumption, labelled IA to IG. Eurostat's headline figure for non-household consumers refers to the band of medium-sized consumers with an annual consumption between 500 and 2,000 MWh (band IC).
| Band | Annual consumption |
|---|---|
| IA | below 20 MWh |
| IB | 20 to below 500 MWh |
| IC | 500 to below 2,000 MWh |
| ID | 2,000 to below 20,000 MWh |
| IE | 20,000 to below 70,000 MWh |
| IF | 70,000 to below 150,000 MWh |
| IG | 150,000 MWh or more |
A large crystal-growing plant or chip fab sits in the upper bands, not in the headline band. Using the IC figure for such a plant can be badly misleading, because network charges and many levies are structured differently for large consumers, and because some countries apply reductions for energy-intensive users. Some values for the largest bands are also confidential in some countries, because few consumers fall into them.
Three price levels
Eurostat publishes each price at three levels:
- Excluding taxes and levies: energy and supply plus network costs.
- Excluding VAT and other recoverable taxes: includes the taxes and levies a business cannot recover. This is the relevant level for comparing costs between businesses, and it is the basis of Eurostat's headline non-household figure.
- Including all taxes: mainly relevant for households, since businesses usually reclaim VAT.
Three components
The annual component data split the price into energy and supply, network costs and taxes, fees, levies and charges. Comparing countries component by component often explains more than the total: two countries with similar totals can differ sharply in network charges, which depend on connection voltage and load profile, or in levies, where exemptions may apply.
Wholesale is not what a factory pays
Day-ahead wholesale prices are published daily and are often quoted in the news. A factory, however, pays a retail or contract price that includes network charges, taxes and levies, and that reflects how its supply was bought: fixed-price contracts, indexed contracts, or long-term power purchase agreements (PPAs) with renewable generators. Eurostat's figures are averages across the contracts actually in force in a half-year, so they lag behind wholesale markets in both directions. For wholesale market developments, the EU agency ACER publishes market monitoring reports; for international comparisons beyond the EU, the IEA Energy Prices database is the usual reference.
Policy changes to watch
- Affordable Energy Action Plan: the Commission presented an action plan on energy costs in February 2025 as part of the Clean Industrial Deal (European Commission, Affordable energy).
- State aid for electricity costs: the Clean Industrial Deal State Aid Framework of June 2025 allows Member States, under conditions, to relieve electricity costs for energy-intensive companies exposed to international competition, in exchange for decarbonisation investment (Net-Zero Navigator: CISAF). Whether a sector or site qualifies depends on national schemes.
- Network tariffs: set nationally by regulators, they can change with grid investment programmes; they matter most for large loads.
A checklist for comparing sites
- Estimate annual consumption and load profile, and pick the matching Eurostat band, not the headline band.
- Compare at the level "excluding VAT and other recoverable taxes".
- Look at the component split to see whether differences come from energy, network or levies.
- Check national reductions for energy-intensive users and whether the planned process would qualify.
- Ask the grid operator for the connection voltage and the network tariff that would apply.
- Price long-term supply options, including PPAs, separately from the statistical averages.
- Use the latest half-year and note its date; Eurostat states when the next update is due.
Energy cost is one of several site criteria; the others are covered in siting wafer and module plants in Europe and site requirements for wafer and chip plants.
 Industry & Policy
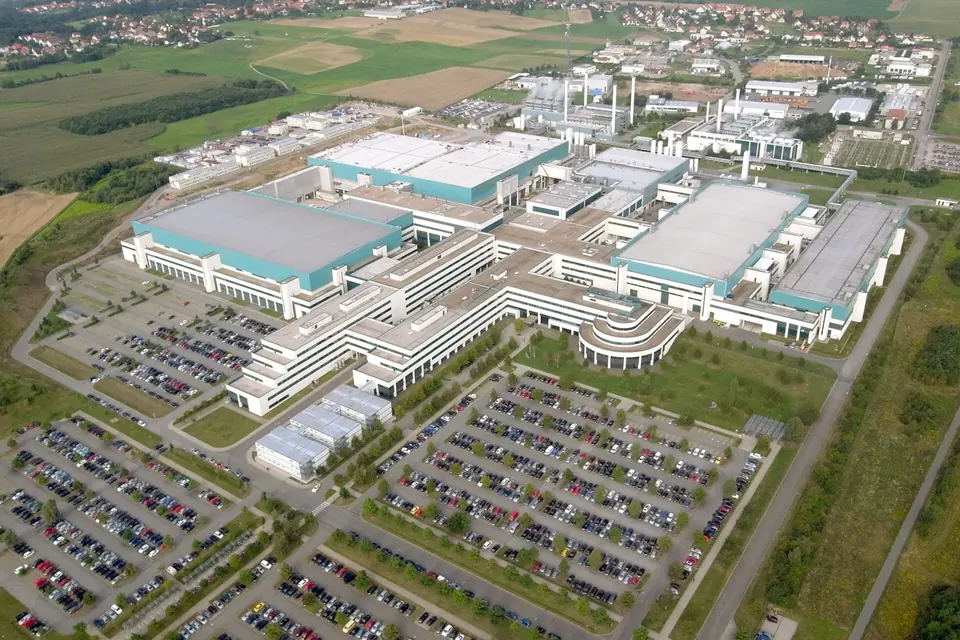
Siting wafer and module plants in Europe
What the Net-Zero Industry Act and the Chips Act offer a new plant, and the practical criteria for choosing a site.
 Industry & Policy
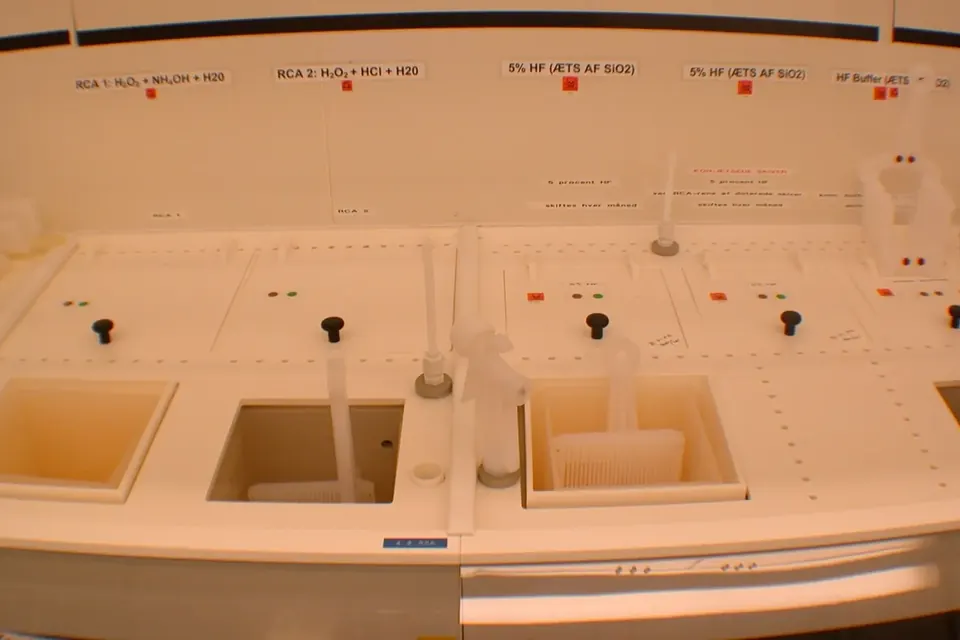
Site requirements for wafer and chip plants
Cleanroom classes, ultrapure water, grid connection and zoning: what a wafer or chip site must provide.
 Industry & Policy
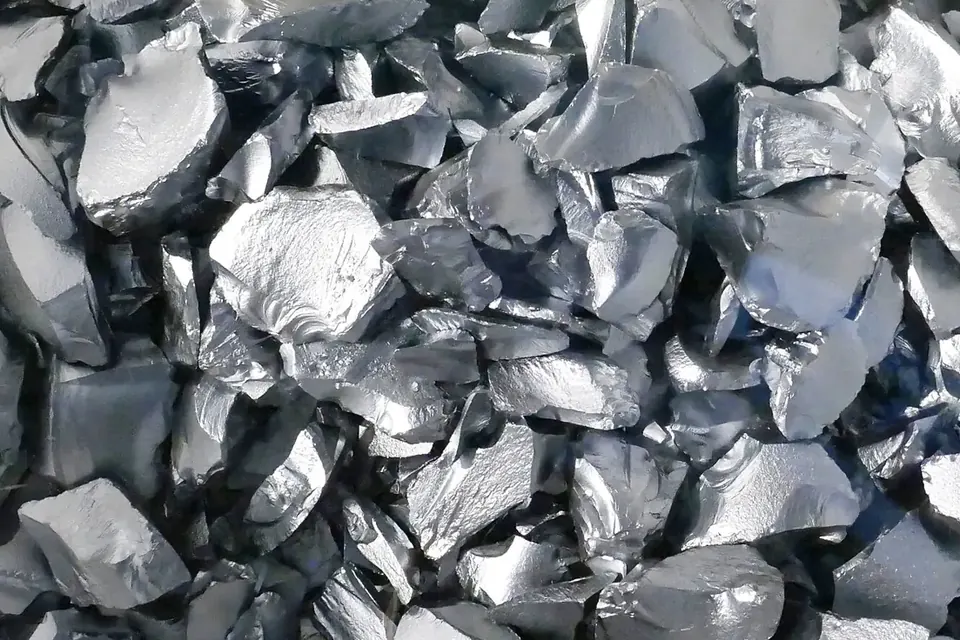
Critical raw materials and silicon
Silicon metal, gallium and germanium under the EU Critical Raw Materials Act: benchmarks, permits and supply risk.